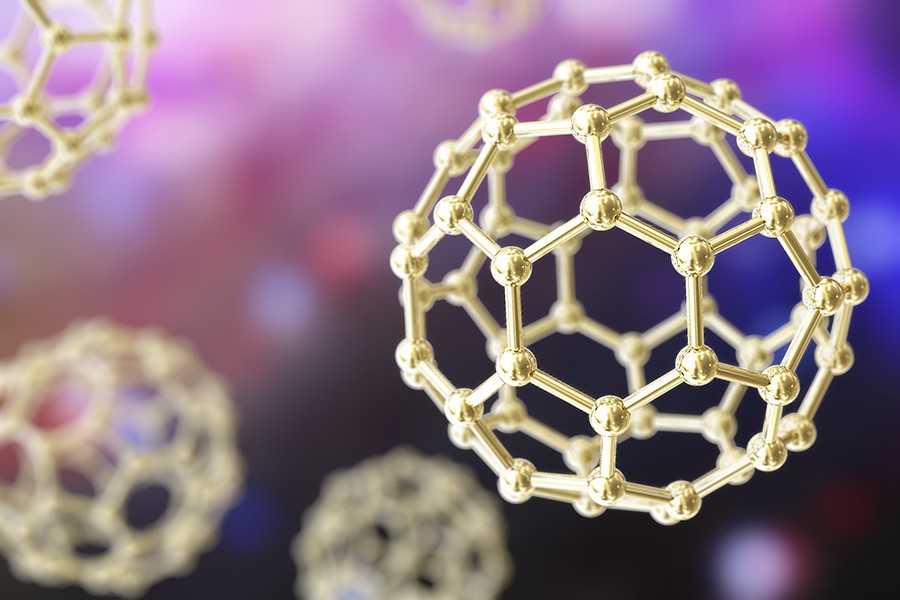
Nanotechnology is pretty useful in our day to day. Titanium dioxide in our sunscreen to block out UV radiation, carbon nanotubes in hockey sticks for rigidity and silver nano-particles in our socks to stop our feet from smelling. Nanoparticles can be used to treat tumours because they can only pass through the pores of the tumour rather than through other tissue as tumour tissue has larger pore spaces. That is all well and good, but what is the actual definition of a nanoparticle? Basically an particle with one dimension below 100 nm.
Around 320,000 tonnes of nanoparticles enter the environment every single year many of which pose health risks, however most of these particles end up in the landfill which is ideal, but I wouldn’t be writing this blog if that was it. A proportion of particles that don’t get adsorbed by organic components and flocculate and sink to the bottom of the rivers and streams end up in our waste water to be recycled back to drinking water.
But wait a minute… our drinking water gets filtered and purified and cleaned and compared to standards so that we can drink it safely, I hear you say.
To some degree that is true, of course, but most predictions of how much gets filtered out by the sand in the gravity filtration vats are based on computer models. Dr. Ian Molnar a Canadian hydrologist and his team realized that computer models tended to overestimate how much filtering the filters actually did in terms of reducing the concentration of nanoparticles.
Water treatment plants estimate the retention rate of nanoparticles using the Colloid Filtration Theory (CFT) (a complicated mathematical formula – I won’t go into more detail here), however nanoparticles only move via Brownian motion and diffusion they don’t tend to interact with the grains of sand at all. CFT works really well predicting behaviour of microparticles as they interact with surface charges of grain boundaries.
Molnar and his team conducted a simple column experiment with glass beads and wanted to see how silver nanoparticles (27nm) behaved with regards to the surface of the glass beads. Basically seeing how well the CFT actually fit the observations. They initially used X-Ray Tomography but the resolution was only 10 microns which was too low if you wanted to image the behaviour of particles that are 27nm in size. They then decided to try Absorption-Edge Imaging which was able to image above and below the edge of the grain which meant they could actually produce a 3D map of the nanoparticle behaviour.
After the analysis of the 3D map, the team found that the CFT can’t predict what happens to 40% of the mass of nanoparticles away from the grain surface. Since 50% of all mass flow occurs outside of the grain, the CFT obviously grossly over estimates the retention of nanoparticles in sand grains.

So in short, this means that we are all drinking harmful nanoparticles!? Not quiet. The work done by Molnar and co has implications on the current computer models used by water treatment plants to help further optimize their filtration process. The current processes in place in these facilities reduce most harmful materials entering the drinking water to safe levels for us to drink. It is however important to still address these issues as more and more nanopartocles are making their way to into the ecosystem in forms of cosmetics, fertilizers and industry just to name a few. If you want a detailed report on the nanoparticle concentrations from each industry in the UK read this report from the Food and Environment Research Agency and co.
